


|
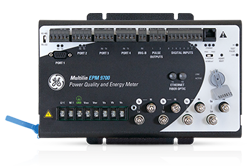
EPM 9700
High Performance Power Quality Metering with Advanced Logging and Communications
The Multilin™ EPM 9700 is a high performance power quality meter with advanced logging capabilities and flexible communication options. As a member of GE’s EPM meter family, the EPM 9700 provides a comprehensive picture of power quality and consumption for metered points within an electrical system, empowering users to make power related analysis and decisions quickly and effectively, as well as recording data for accurate reconciliation. Its versatile transducer and display installation, along with comprehensive and innovative metering and communication features are ideal for utility, industrial and commercial power quality applications. |
EPM 9700 Overview
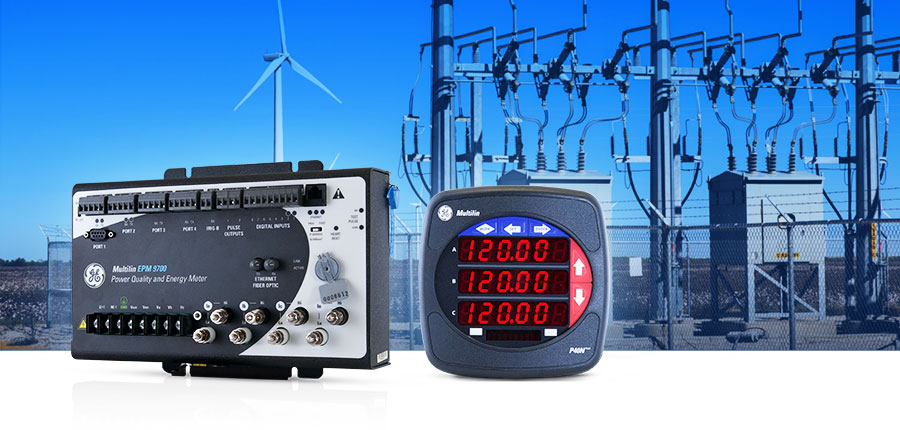
The EPM 9700 is ideal for revenue and power quality monitoring in a variety of applications, including utility substations, renewables, advanced industrial manufacturing, datacenters and hospitals. It provides a number of key features and benefits, as outlined below.
Accurate Revenue Energy Metering
The EPM 9700 uses advanced high and low gain current sensors for each of the current inputs and determines the optimal sensing circuit for the highest accuracy measurement. This allows the EPM 9700 to have 0.06% accuracy (ANSI Class 0.2%) in an extended measurement range. The wide range pickup of the meter current sensors used also allow the same meter to be used for both 5A and 1A secondary CTs which allows for easier ordering and standardization for multiple applications.
IEC 61000-4-30 Class A Edition 3 Power Quality Meter
IEC 61000-4-15 Class A Flicker Meter
IEC 61000-4-7 Class A Harmonic and Inter-harmonic Analysis
Waveform Recording
To troubleshoot, remedy and predictively analyze potential system challenges, the EPM 9700 can record waveforms at a sampling rate up to 1024 samples/cycle on multiple power quality events, such as surges and/or sags.
The 16-bit A/D conversion provides precise waveform resolution. Both voltage and current recording offer pre and post-event analysis. Fault recording offers 8 times full-scale capture capability. Both hardware and software triggers are available. GE Communicator setup software as well as the EPM 9700 web server provides easy remote setup as well as visualization of waveform data.
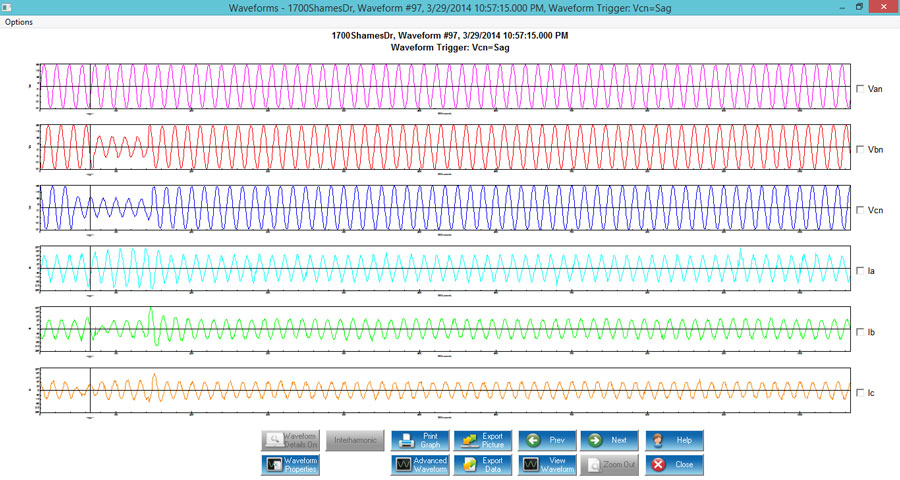
Record and Analyze Waveform fault and Transient Data
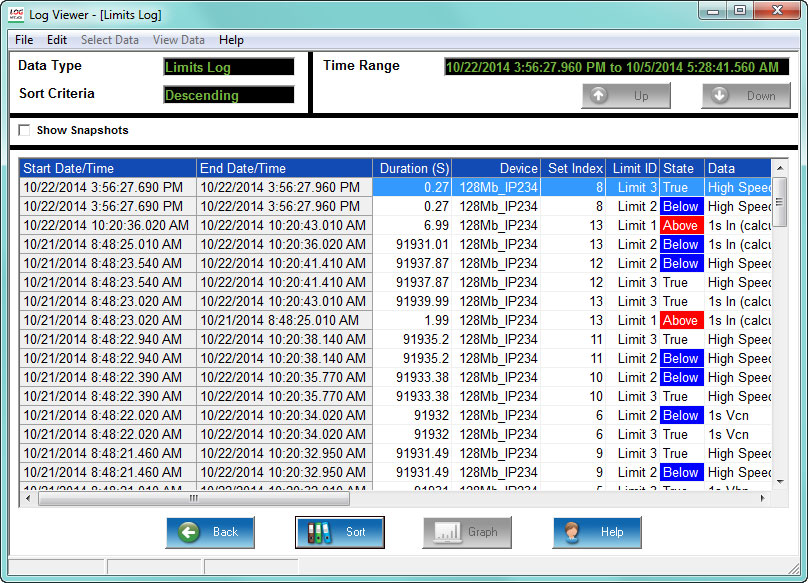
Comprehensive Automated Data Logging
The EPM 9700 meter provides advanced data logging capabilities over time, for trending and analysis. The meter has up to 1.2 GB allocated to logging and user storage, and is also preconfigured to automatically store 142 different measurements (in the CORE™ log) every 15 minutes, without any user intervention. Additionally, a user is able to configure up to 8 historical logs. All logs work with a FIFO buffer and roll over when filled. The EPM 9700 logs important system events such as resets, programming changes, password access changes, time changes
power up/down and change of firmware.
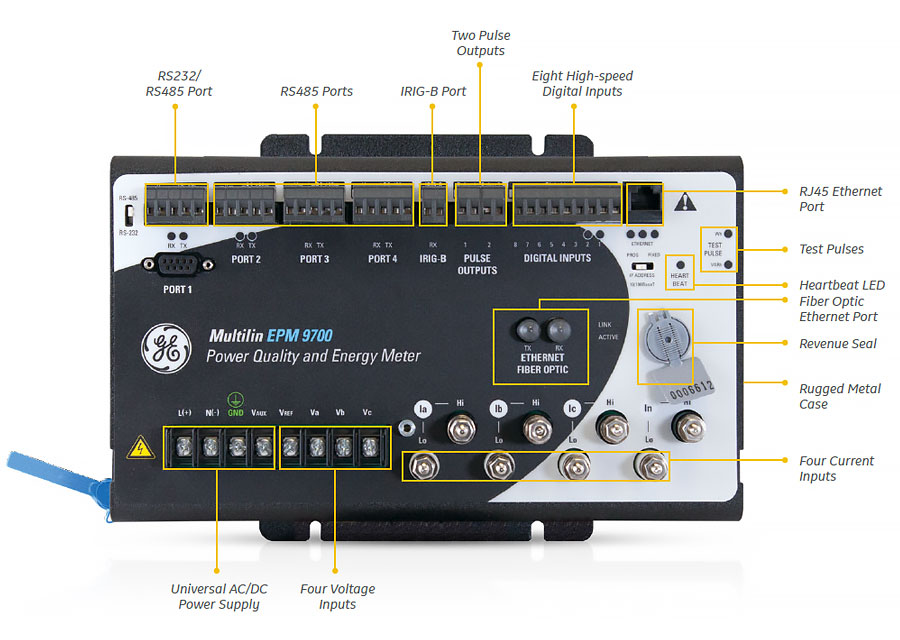
Extensive Communications and I/O
The EPM 9700 meter is equipped with extensive communication capabilities that allow it to speak with many different SCADA or other communication systems, simultaneously. The meter has 6 communication ports as a standard offering. These ports include 4 serial ports and 2 Ethernet-based communication ports. The Ethernet ports include an ST terminated fiber optic port and an RJ45 port. Both ports use separate IP addresses, so that they can run on simultaneous redundant networks.
|
Details of Ports:
8 Built-in Digital High-speed Status Inputs:
|
VAUX Input:
Two Standard Pulse Outputs:
|
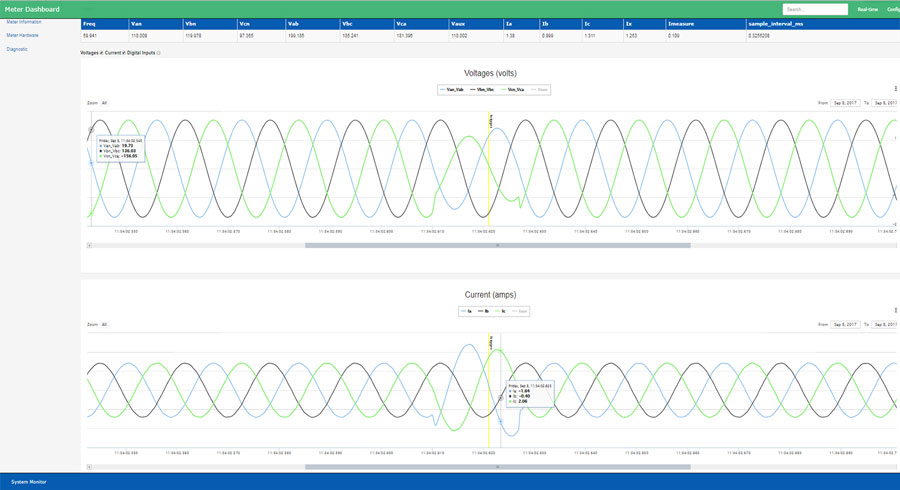
WebView Energy Dashboard
The EPM 9700 supports direct remote Energy and Power Quality Data visualization through an enhanced HTML 5 based web server which provides response formatting, browser based access on a multitude of devices including tablets, phones and workstations. The enhanced web server eliminates the need for additional hardware and/or software to access data on the particular meter remotely.
The visualization includes an Energy Dashboard providing users with easy to understand graphical real time data, as well as to analyze stored historical logs, alarms, and waveform records.
Using the WebView™ Energy Dashboard, the user is able to navigate easily through multiple webpage views, to view a multitude of detailed information on energy usage and power quality such as:

Meter and diagnostic Information for meter applications and troubleshooting